Show:
The Future of Data Visualization: Interactive Graphs and Charts
December 27, 2022
 Business
Interactive graphs are data visualizations that improve the way we engage with information. Graph displays employed by analytics and business intelligence applications are sometimes referred to as interactive visuals. These visualizations are most frequently employed in the form of interactive dashboards, which give a simple method to interpret insights based on fast-changing data.
Due to its ease of use and additional value, interactive graphs are becoming increasingly popular in organizations today and are now a standard component of most analytics packages.
Interactive graphs allow users to explore, alter, and engage with data by using dynamic charts that change colors and forms based on searches or interactions. Importantly, interactive visualizations improve access to real-time data, making them useful in dashboards for enterprises of all sizes and sectors. The ability to evaluate data as it arrives and changes are critical for making the best and most accurate judgments.
Let’s dive deep to understand more about Interactive Graphs!
What are Interactive Graphs?
The use of modern data analysis software to interactively alter and study graphical representations of data is referred to as interactive graphs. Interactive graphs provide visual aids to assist analysts in quickly grasping the relevance of data. This approach is enhanced by interactive charts software, which incorporates interaction capabilities that allow the user to modify the settings of data visualization, allowing the user to see more information, produce fresh insights, raise interesting questions, and capture the full value of the data.
The Importance of Interactive Graphs
Summarizing a large amount of data
Interactive graphs are aesthetically appealing and can draw a lot of attention. It can be helpful for summarizing large amounts of data using complex numbers. It can also aid in the creation of various reports or data forecasts.
Visualize the Specifics
It might be tough to put specifics in a script at times. A graphical depiction can highlight your ideas in a way that makes them easy to read and understand.
Highlighting the Crucial Point
An email containing a lot of material tends to lose its significance. As a result, it is critical to capture and engage the viewers’ attention. An interactive graph might help here by emphasizing the main points. It will capture the attention of the viewers in one shot and will provide exact information.
Graphs can be trusted
Sounds Weird, right? It is natural for humans to glance at an image first, followed by words. If any information is provided in the shape of a graph or in any other visual form, readers are likely to glance at and evaluate the graph right away.
Applications
- Research companies who want to share varied facts and results.
- Manufacturing companies Who want to share the results of their annual report with their shareholders
- Educational institutes who wish to share their prior accomplishments and placement records.
- Food and Beverage companies who wish to compare their nutritional content to that of their competitors.
- E-commerce websites that want to compare the characteristics of several products.
Which Is the Best Tool for Interactive Graphs and Charts?
FusionCharts offers a stunning charting and graphing library that can be used to create interactive graphs, charts, and dashboards. There are over 100 charts, graphs, and gauges, as well as over 2000 choropleth maps, to help you view various forms of data.
FusionCharts is a Javascript library with standard APIs that works with all browsers on all platforms and devices, including iOS and Android. Developers can easily integrate flexible graphics into software designed using frameworks such as Java, Django, React, Angular, Svelte, and others.
How Does FusionCharts Make Graphs Interactive?
FusionCharts has a comprehensive range of options for handling user interactions at various stages of a chart or graph’s lifespan. You can use the preset behaviors or specify your unique actions for various chart events.
These behaviors and modifications bring your charts to life and make them responsive to various user actions and events. For example, You can set separate handlers for when your chart begins loading, finishes rendering, or updates. All user events can be readily customized. These include the user clicking a data point, zooming or scrolling, and other similar actions.
Interactive Graphs and Charts Examples
Let’s have a look at some examples of Interactive Graphs that allow viewers to interact with them.
Sankey Chart
A Sankey chart is used to show quantitative flows and their relationships. The thickness of the lines is determined by the size of the flow.
These can be shown as arrows or lines that, as they go across the diagram, can separate or join depending on the direction they are heading.
Sankey diagrams are excellent for depicting the path taken by users, money, or energy. It can be constructed as a single giant figure or as a series of small diagrams.
Below are the examples of the Sankey Chart
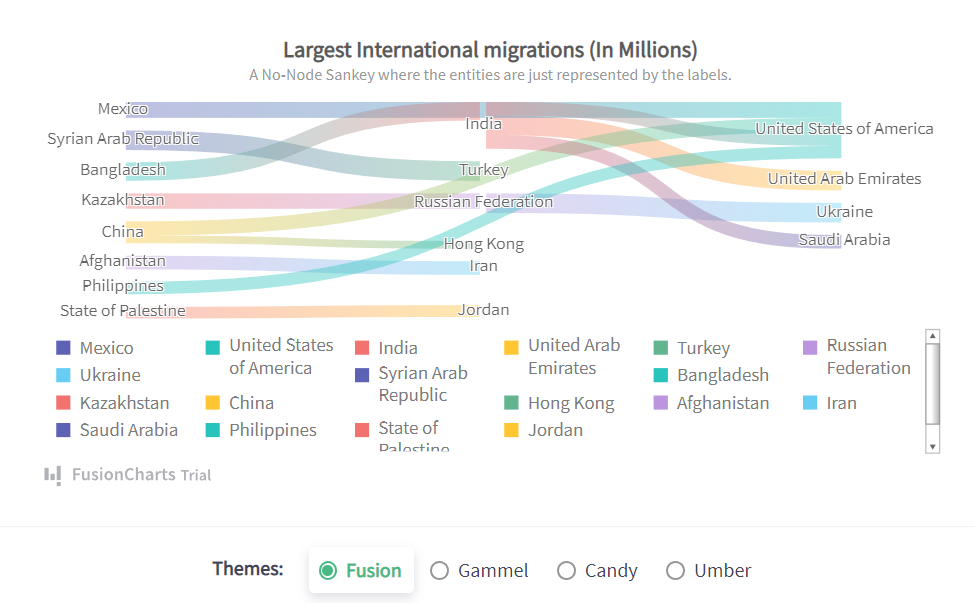
Sankey Chart showing the data of Largest International Migration
Chord Chart
A chord chart is used to show the interdependence of several groupings. The values of the groups or entities are structured in a circle, and the relationships between them are generated and depicted with different colored curves.
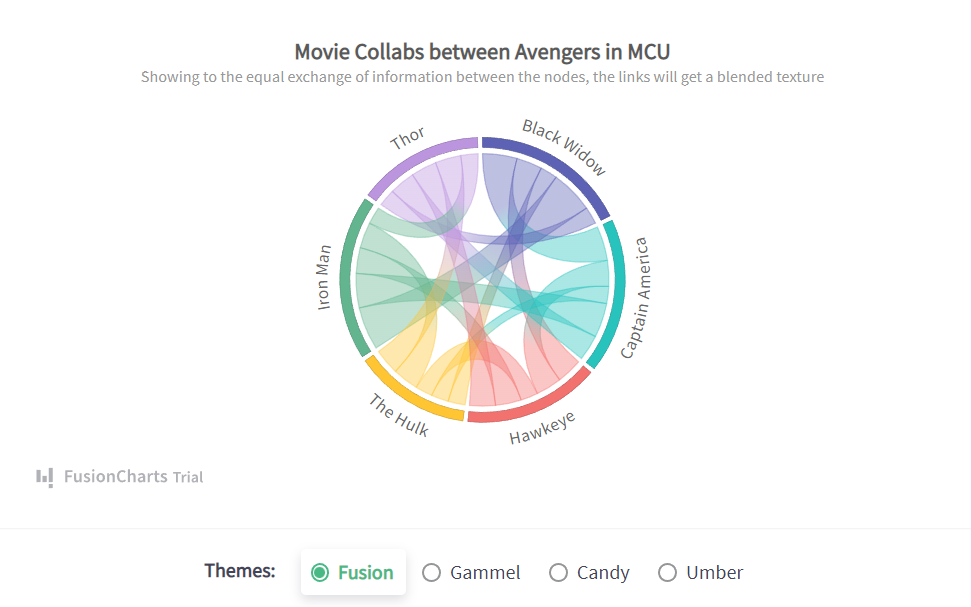
Chord diagrams are useful for displaying vast quantities of data, but they can become visually confusing if there are too many variables. This can be reduced by utilizing interactivity, which allows the user to pick variables or areas, making all others disappear or placed behind an overlay.
Box and Whisker Plot
A box plot is a type of graphic that depicts data distribution and variability. Box plots are divided into parts that represent distinct aspects of a data collection. Here’s an example of a box plot.
The actual box is divided into two halves to indicate the interquartile range.
The median is the line connecting the two quartiles. The 25th-50th percentile is to the left of the median, while the 50th-75th percentile is to the right of the median.
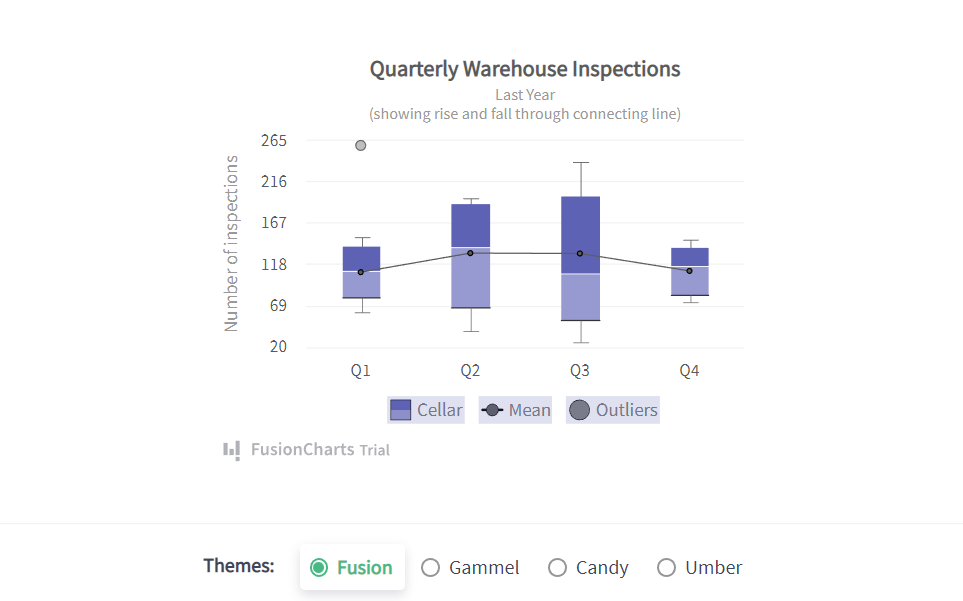
The whiskers extend from the box and show the variables in the upper and lower quartiles. The lines on the edge of the whiskers represent the data set’s minimum and maximum values. Outliers are shown as dots outside of the min and max values.
Remember that a box plot can be either horizontal or vertical. Which one you pick will be determined by the number of data sets you need to view.
Interactive Decision Tree
Websites containing a lot of information might be daunting at times. Using an interactive decision tree assists your visitors in deciding what they require from your content.
A decision tree is similar to a flowchart, however, it differs from its static counterpart. What distinguishes a decision tree is that it is entirely interactive and intuitive.
Treemap
A treemap is a form of a hierarchical chart that displays the values of items in different categories. The values are shown as squares and rectangles within a bigger rectangle.
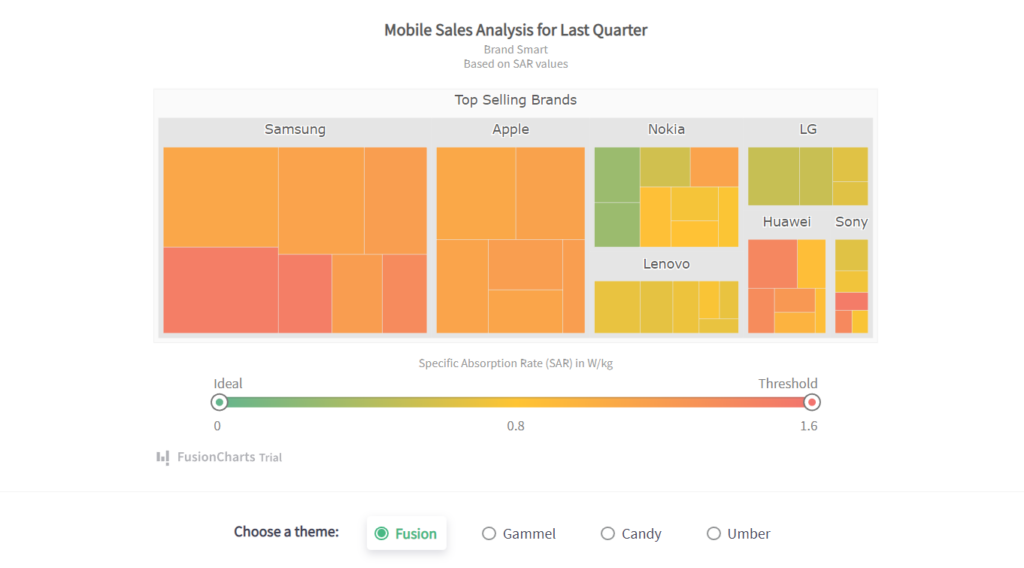
The largest value is presented at the top left, and decreasing values are displayed in a clockwise orientation, with the lowest values showing at the bottom right corner.
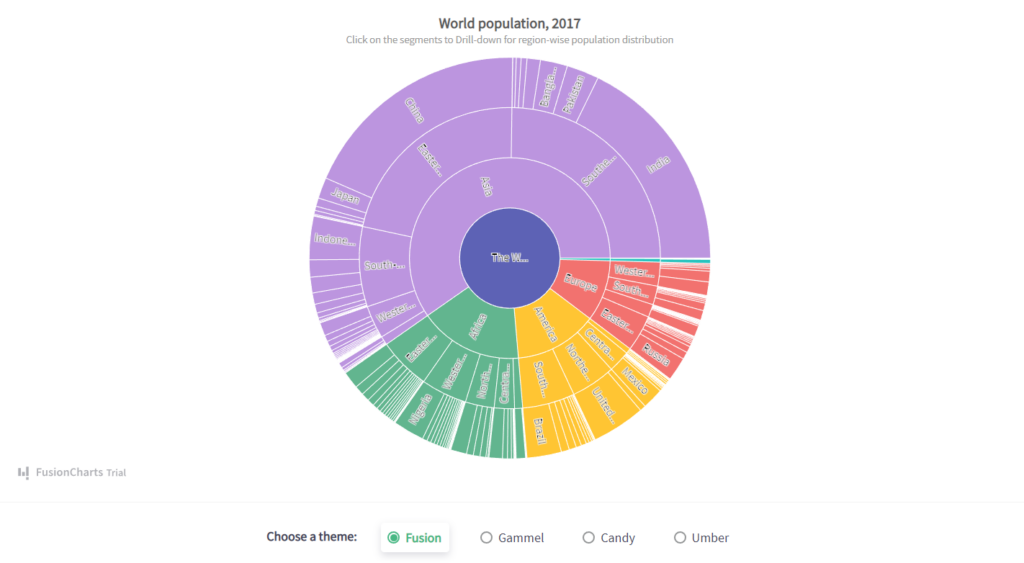
Sunburst Chart
Sunburst charts, also known as ring charts and radial treemaps, are used to illustrate a hierarchical dataset.
It depicts hierarchy as a series of concentric rings, with each ring representing a level in the hierarchy. Each ring is proportionately split to show its essential features. Focusing on a ring segment provides a sense of the segment’s part-to-whole connection with regard to its parent ring segment.

A Sunburst chart creates an immersive graphical experience of the classified dataset by using a radial pattern. It is a space-filling representation using a radial layout rather than a rectangular one (like a Treemap) The Sunburst chart is a great way to explain how one ring is split down into its constituent parts (i.e, sequential segments).
Waterfall Chart
A waterfall chart is used to show how an initial value is increased and decreased by a series of intermediate values before reaching a final value.
A waterfall chart is commonly used in the finance industry to demonstrate how a net value is calculated by separating the aggregate effect of positive and negative contributions.
To better comprehend things, let’s look at the below example. A basic example would be an inventory audit of men’s t-shirts in a retail establishment. You can calculate how many sellable t-shirts you have on hand to start the next month. Typically, there will be some units in stock to begin the month. Some of the units will be destroyed while the t-shirt is displayed and various individuals try it on. Some of these damaged units might be restored and added to the stock, bringing us to the number of salable units.
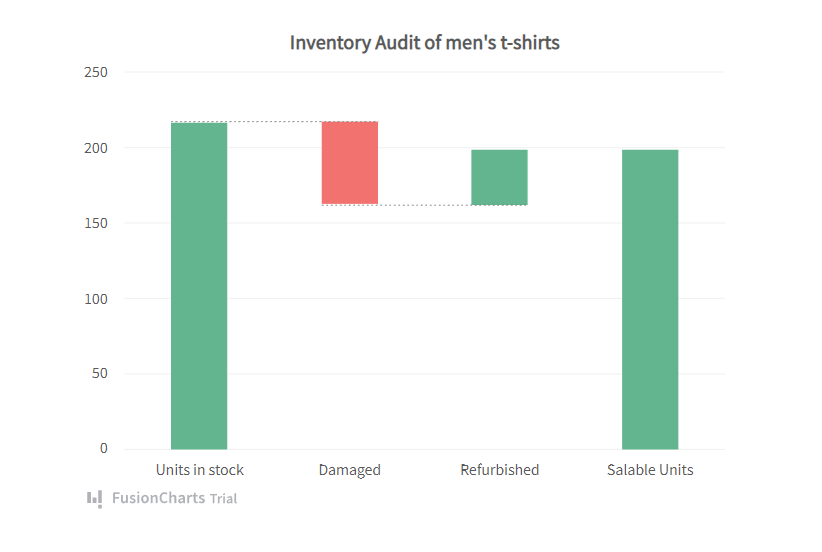
So, in this waterfall chart (also known as the bridge chart), the beginning value of “Units in stock” goes through a succession of ups and downs, one up and one down to arrive at the ultimate value of Salable Units.
Radar (Spider/Web/Polar Bar) Chart
If you were asked to rate your favorite beer based on eight characteristics (sourness, yeast, bitterness, malt, sweetness, hop, saltiness, and special grain) and then display them visually, you might create a Column Chart.
However, when there are a large number of variables (8 in this example), the Column Chart may appear crowded. In such cases, use the Radar Chart instead!
A Radar Chart, also known as a Spider Chart, Radial Chart, or Web Chart, is a two-dimensional chart that shows three or more quantitative variables on an axis that starts at the same position.
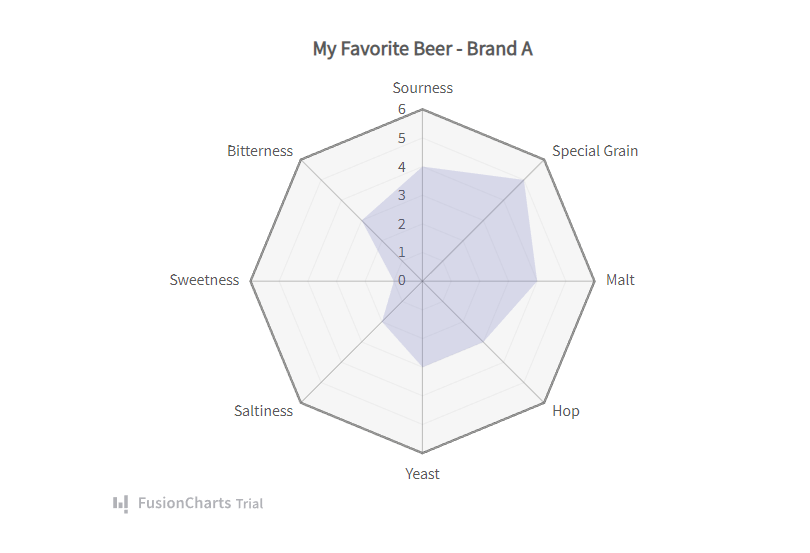
Each of the eight characteristics of our beer example forms a distinct axis that has been positioned radially around a point. The value of each facet is represented by the node (anchor) on the spoke (axis). A line is constructed linking the data values for each spoke. As a result, your Radar Chart displays all of your data values all at once!
So much for one beer, you may think. Assume you have two beers to compare.
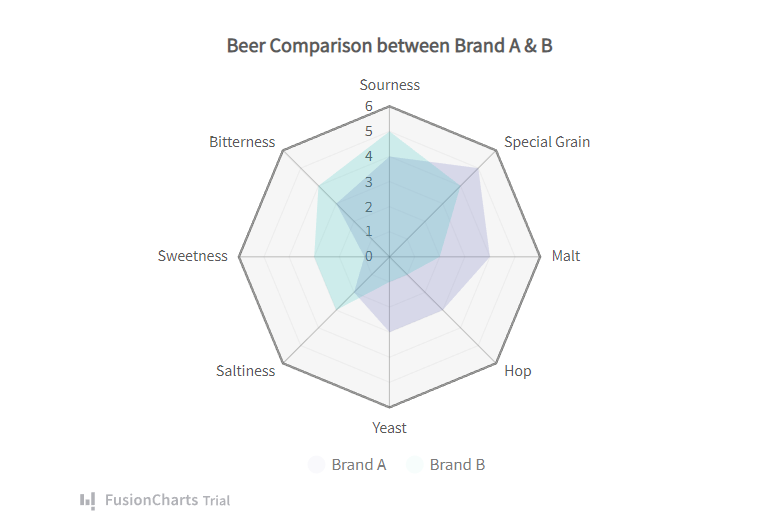
Each of the eight criteria is used to rank the two beers. The color coding for each beer aids in visually correlating and contrasting the drinks’ various qualities. If you want your beer bitter, the chart suggests that you switch to Beer B. (as Beer B has a higher rank in bitterness than Beer A).
Bubble Charts
Bubble charts/graphs plot data described by three unique numerical parameters. They enable the comparison of things based on their relative locations with regard to each numeric axis, as well as their size.
Column charts and line charts often feature two axes: a numeric axis and a category axis. The numeric axis for column and line charts is the Y-Axis. This implies that the location of the plot with respect to the Y-axis indicates the quantitative magnitude of the plot. Bubble charts are distinguished by the fact that their axes are both numerical. As a result, the position of the bubble plot is a predictor of two numerical values. The area of the bubble plot (or the size of the scatter blot bubbles) indicates the magnitude of the third numeric feature.
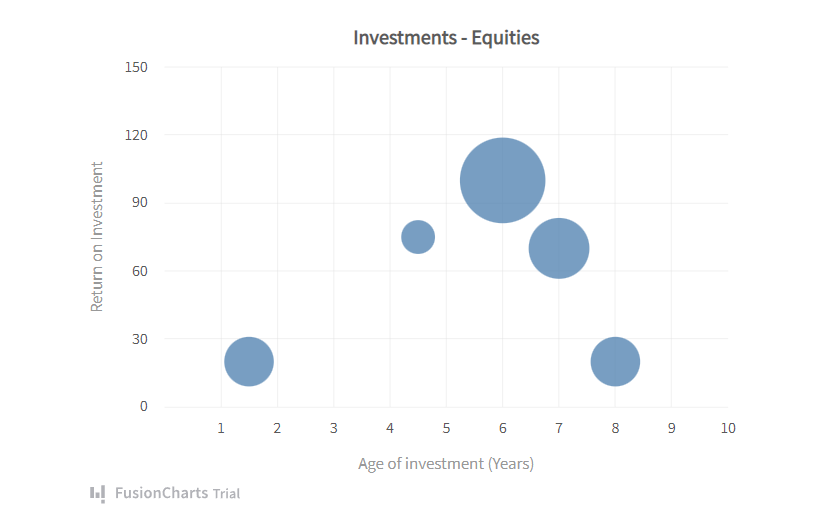
The bubble graph above is intended to assist you in better managing your equity investments. The X and Y axis represents the Age of Investment and Return on Investment, respectively. Aside from these two factors, what is the third parameter in which you are interested? Obviously, how much money have you put into certain equity? As a result, the area of the bubble plot denotes this. A definitely has the highest ROI and the greatest investment amount.
Funnel Chart
The Funnel chart is used to depict the incremental reduction of data as it moves from one phase to the next. Data in each of these phases is shown as varying percentages of 100%. The Funnel chart, like the Pie chart, lacks an axis.
Each funnel step accounts for a fraction of the total. As a result, it takes the shape of a funnel, with the initial stage being the widest and largest, and each following step is smaller than the preceding stage. The first step, the “intake” stage, is usually the largest.
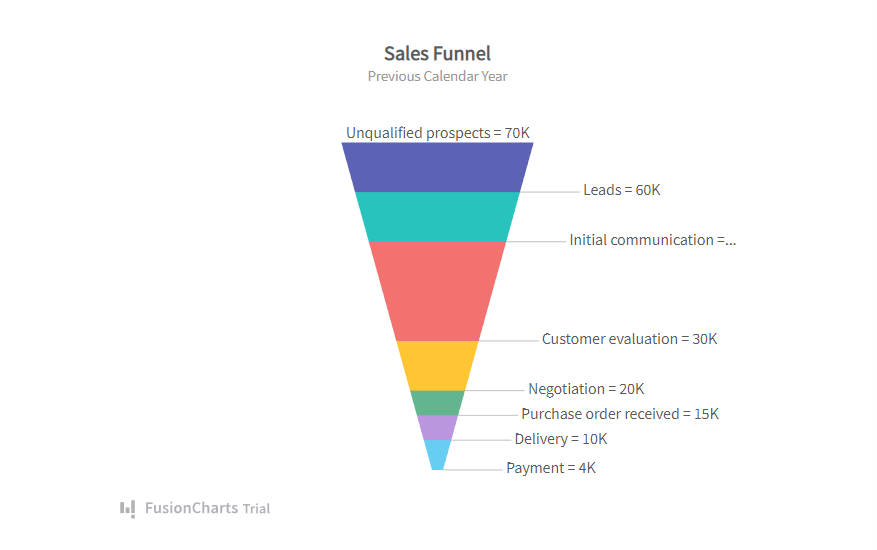
The Funnel chart is most commonly used to visualize sales conversion statistics.
Multi-level Pie Chart
Multi-level pie charts are made up of a series of concentric rings. The magnitude of each item shows its contribution to the inner parent category.
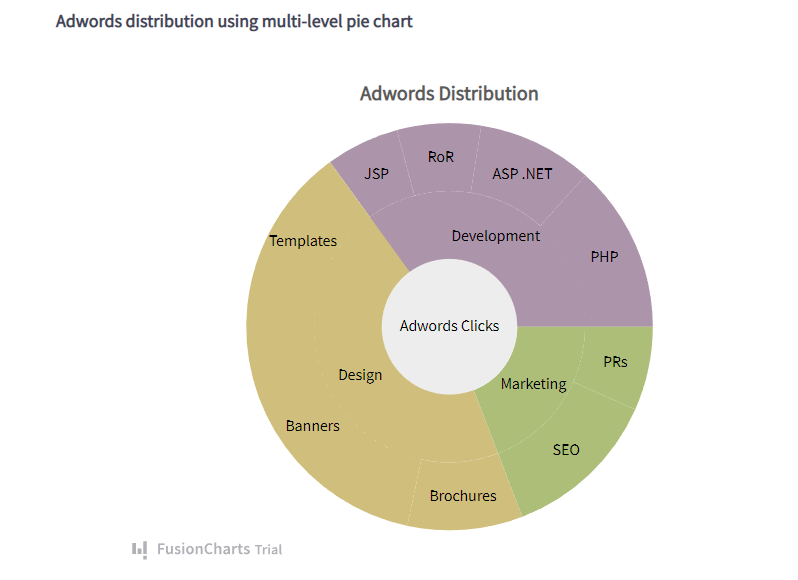
It starts with a single object arranged in a circle in the center. A concentric ring is placed around the core circle to show the item’s breakdown. After then, the concentric ring is split to indicate how numerous child items contributed to the parent item. Another concentric ring is built up to show the breakdown of each of these child items. Because we want to witness the breakup of the child items, the new ring will already be split in the same way as the previous ring. Further segmentation is performed inside these segments to view the breakdown of each of the child elements in turn and this method can be repeated indefinitely.
Zoom Charts
The capacity to observe data at multiple degrees of granularity is the most significant benefit of employing zooming charts, especially when the data under observation is large and can be grouped into layers for easy comprehension. The ability to zoom in and out allows for simple viewing of data at different macroscopic and microscopic levels.
Zoom line charts are simply line charts with the ability to zoom in and out.
Examine the zoom line chart below, which compares the daily amount of footfalls in a store with online visitors to the store’s website for each day of a whole year.

At first glance, the zoom line chart shows how the trend for both data sets advances. You can analyze data for certain months, weeks, or days by zooming in on the chart until the lowest degree of granularity is reached. Isn’t it amazing?
Candlestick Charts
The Candlestick chart is created using a data collection that comprises Open, Close, High, and Low values for each time period you want to display. The Body refers to the hollow/solid component. Upper and Lower Shadow are the lines above and below the Body. The top of the Upper Shadow represents the highest trading price, while the bottom of the Lower Shadow represents the lowest trading price.
When there is selling pressure (Bearish inclinations), the Opening Price is greater than the Closing Price, and you get a solid body. In contrast, when there is purchasing pressure (Bullish inclinations), the Closing Price exceeds the Opening Price, resulting in a hollow body.
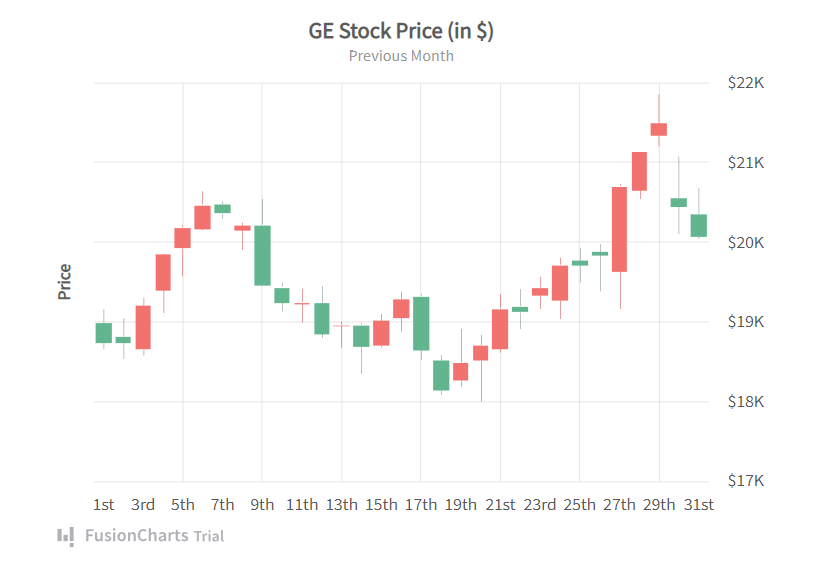
Each Candlestick displays the opening, closing, maximum, and lowest trading prices of the stock on that specific day. Candlesticks can form a variety of designs based on these four costs, including Engulfing, Hammer, Shooting Star, Doji, and many others.
Closing Thoughts
Interactive graphs are increasingly being used in a wide range of sectors and are now a crucial part of business intelligence and data analysis tools.
What makes these interactive charts and maps so appealing are that they allow users to not only observe but also explore, alter, and otherwise interact with the data through various actions.
Perhaps the most significant advantage of interactive graphs is their capacity to provide the most recent data, which leads to well-informed and precise judgments.
In general, data visualizations enable enterprises to diversify how they show data. This leads to more in-depth knowledge and specialized analysis, which might result in fresh discoveries and unexpected outcomes.
Interested in improving your ability to explain facts and difficult ideas with Interactive graphs and charts? Get your enterprise started with interactive data visualization now.
 Return to Previous Page