Show:
How to Evaluate Email Campaign Success

New and exciting developments can pique the interest of a tech-savvy digital marketer, but when it comes to tried-and-tested reliability, nothing beats running an email campaign. The number of daily emails sent worldwide is projected to hit more than 300 billion by next year, and it’ll only go up from there.
Email marketing isn’t staying static, either. An email campaign can make use of emerging technologies just as other sectors of digital marketing can.
The most impactful ones being improvements to automation, artificial intelligence, and data analytics. Email providers are stepping up, too (Gmail implementing AMP functionality and Dynamic Email comes to mind).
With progress marching on for email marketing, and with it retaining its crown as the digital marketing channel offering businesses the highest ROI, evaluating success is essential. Understanding what resonates with your subscribers moves them closer to becoming paying customers. You won’t be able to pinpoint that information without making looking at benchmarks part of the process.
EMAIL CAMPAIGN BENCHMARKS
Why is it important to research industry benchmarks and eventually create your own down the line? It’s all about proving whether email marketing is worth the time and effort your business invests into it. Email boasts the highest ROI for most businesses, but you won’t know if you can count yourself among those who benefit from it if you don’t have the data to show it.
There are a lot of metrics to cover when it comes to evaluating an email campaign. Unsubscribe rates, bounce rates, and deliverability stats all matter when it comes to knowing whether your lists are healthy and the campaign has been effective for customer loyalty long-term. However, to identify whether the content and structure of your emails themselves work, we can narrow down the benchmarks you should take note of to three.
These three key email campaign benchmarks are open rates, click-to-open rates, and click-through rates. With these three, you’ll be able to identify the biggest strengths and weaknesses of your email campaigns.
1. Open Rate
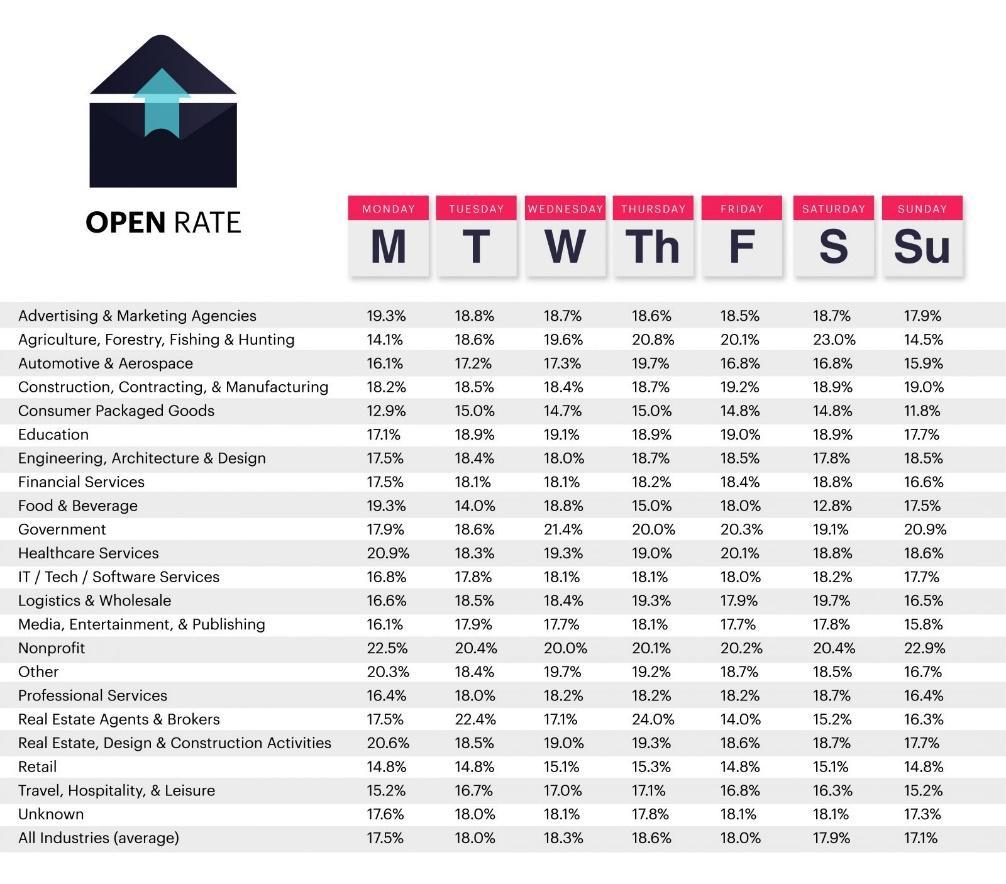
Open rate refers to the percentage of your total number of subscribers who’ve opened an email campaign. The general average for this benchmark sits at 17.92%, although as in the infographic above, different industries have different numbers.
Regardless, you can use this measure to see whether your emails are interesting at first glance. Having a low open rate means your email isn’t relevant to your subscribers. The problem most likely lies within your subject line and the first block of text in your email—the one that shows up in the preview.
Personalizing emails through something as simple as list segmentation can do wonders for open rates. Organizing subscribers by demographics, purchasing history, or location can let you craft more personal subject lines that can get them to open an email. Don’t go overboard on word count, though!
2. Click-through Rate
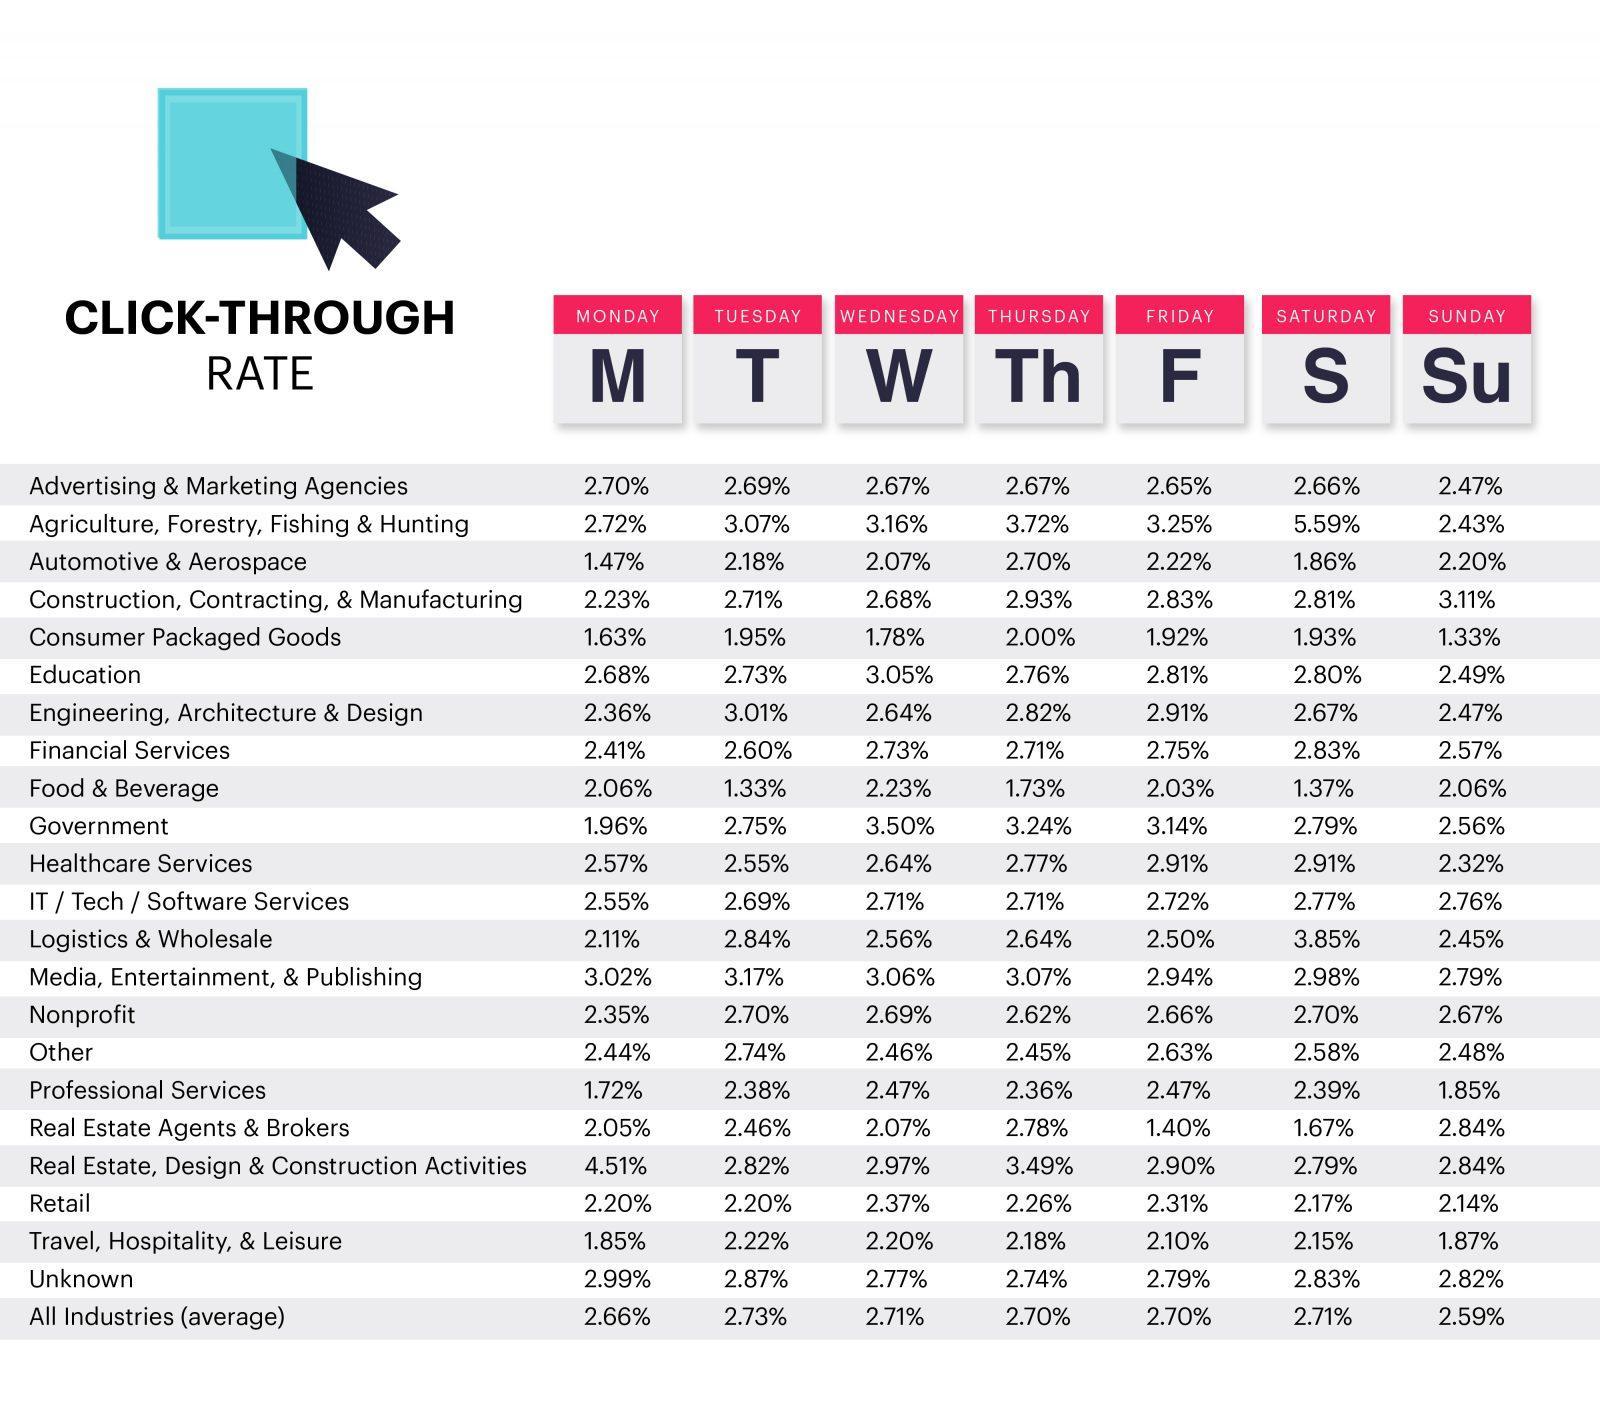
Source: Campaign Monitor
Click-through rate is the percentage measure of users who click on an image or link in your email out of the total number of emails you’ve sent. This total doesn’t take into account whether a user has opened an email or not.
The general average for click-through rate is 2.69%. The chart above also shows the specific industry averages as they vary by day of the week. Click-through rates give insight into the percentage of subscribers who provide traffic to your website (or a similar page) directly from your email campaign.
This tells you all about the content. The point of an email is to get the user to click—so you need to formulate email content to guide them along towards that action. Maintain your brand voice, create a well-designed layout with engaging imagery, and improve calls to action to get this metric higher.
3. Click-to-Open Rates
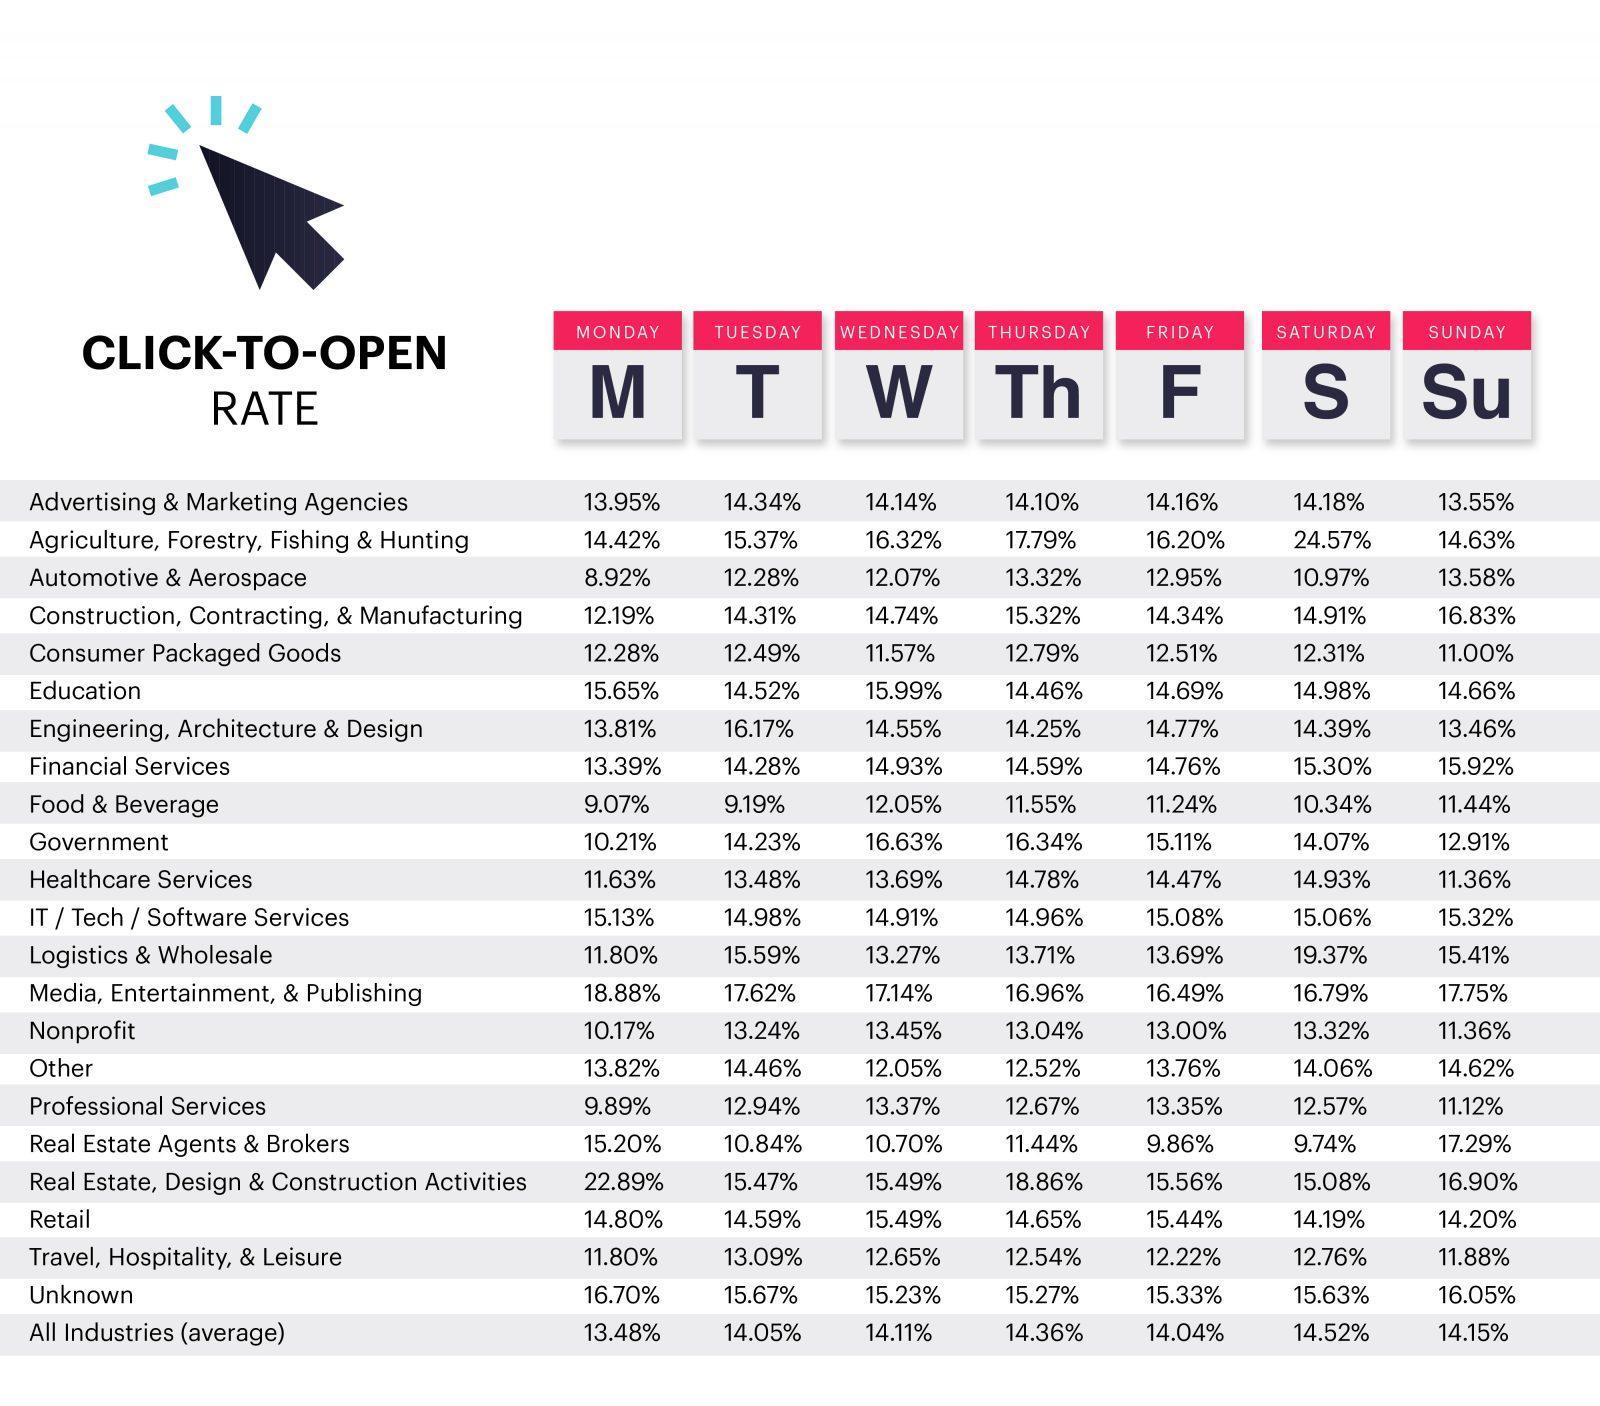
Source: Campaign Monitor
Click-to-open rate is similar to the previous benchmark in that it measures how many clicks on an image or link. Unlike click-through rate though, it measures the percentage of how many subscribers click out of all those who open an email. This makes the resulting number higher than click-through rates—expect an average of 14.10% or similar.
Because it measures against the total number of opens, you can view this as an indicator of the immediate response to an email campaign.
This is a key metric to analyze, as it can dictate the overall health of your campaign. But in case you’re getting lower numbers, the fixes are mostly technical. Ensure your email renders across all devices, especially on mobile. Use a layout easy on the eyes without the user having to pinch and scrolls.
WRAP UP
It’s most likely that a good email campaign looks and works the way it does because of the data that went into crafting it. They don’t just take into account the results of the emails themselves. A good email campaign also uses previous audience data to tailor content according to their preferences.
As a final note, here are some tips for data-driven email marketing to coincide with and further improve on results benchmarking:
- Use a welcome email as an initial data sweep. You can request your subscribers fill out a short form by asking a few questions about who they are, what they like, and where they’re located.
- Connect all your site data to your emails. Some of the most creative email campaigns result from website data. This can include when a person has just made a recent purchase, the kinds of pages a person has been browsing, or whether a person decided to abandon their shopping cart midway.
- Organize your data. You don’t want to cause more stress by trying to find a single set of data among all your other files. Have a single database for each audience segment.
- Test, test, test. A/B test major elements of your campaign (layout, colors, design, etc) for a more granular look at the most engaging options.
Set yourself up with benchmarks, collect the data you need to improve them, and watch your ROI!
 Return to Previous Page